Dentsu Data Project
Visualisations


I spent some time looking at Dentsu's data and distilling it into more useable and shareable formats. Above is a rework of Dentsu's massive research data, which was pretty unuable to dig through. Here the data can be easily filtered to find commonalities and trends, and then exported for Powerpoint/Keynote.
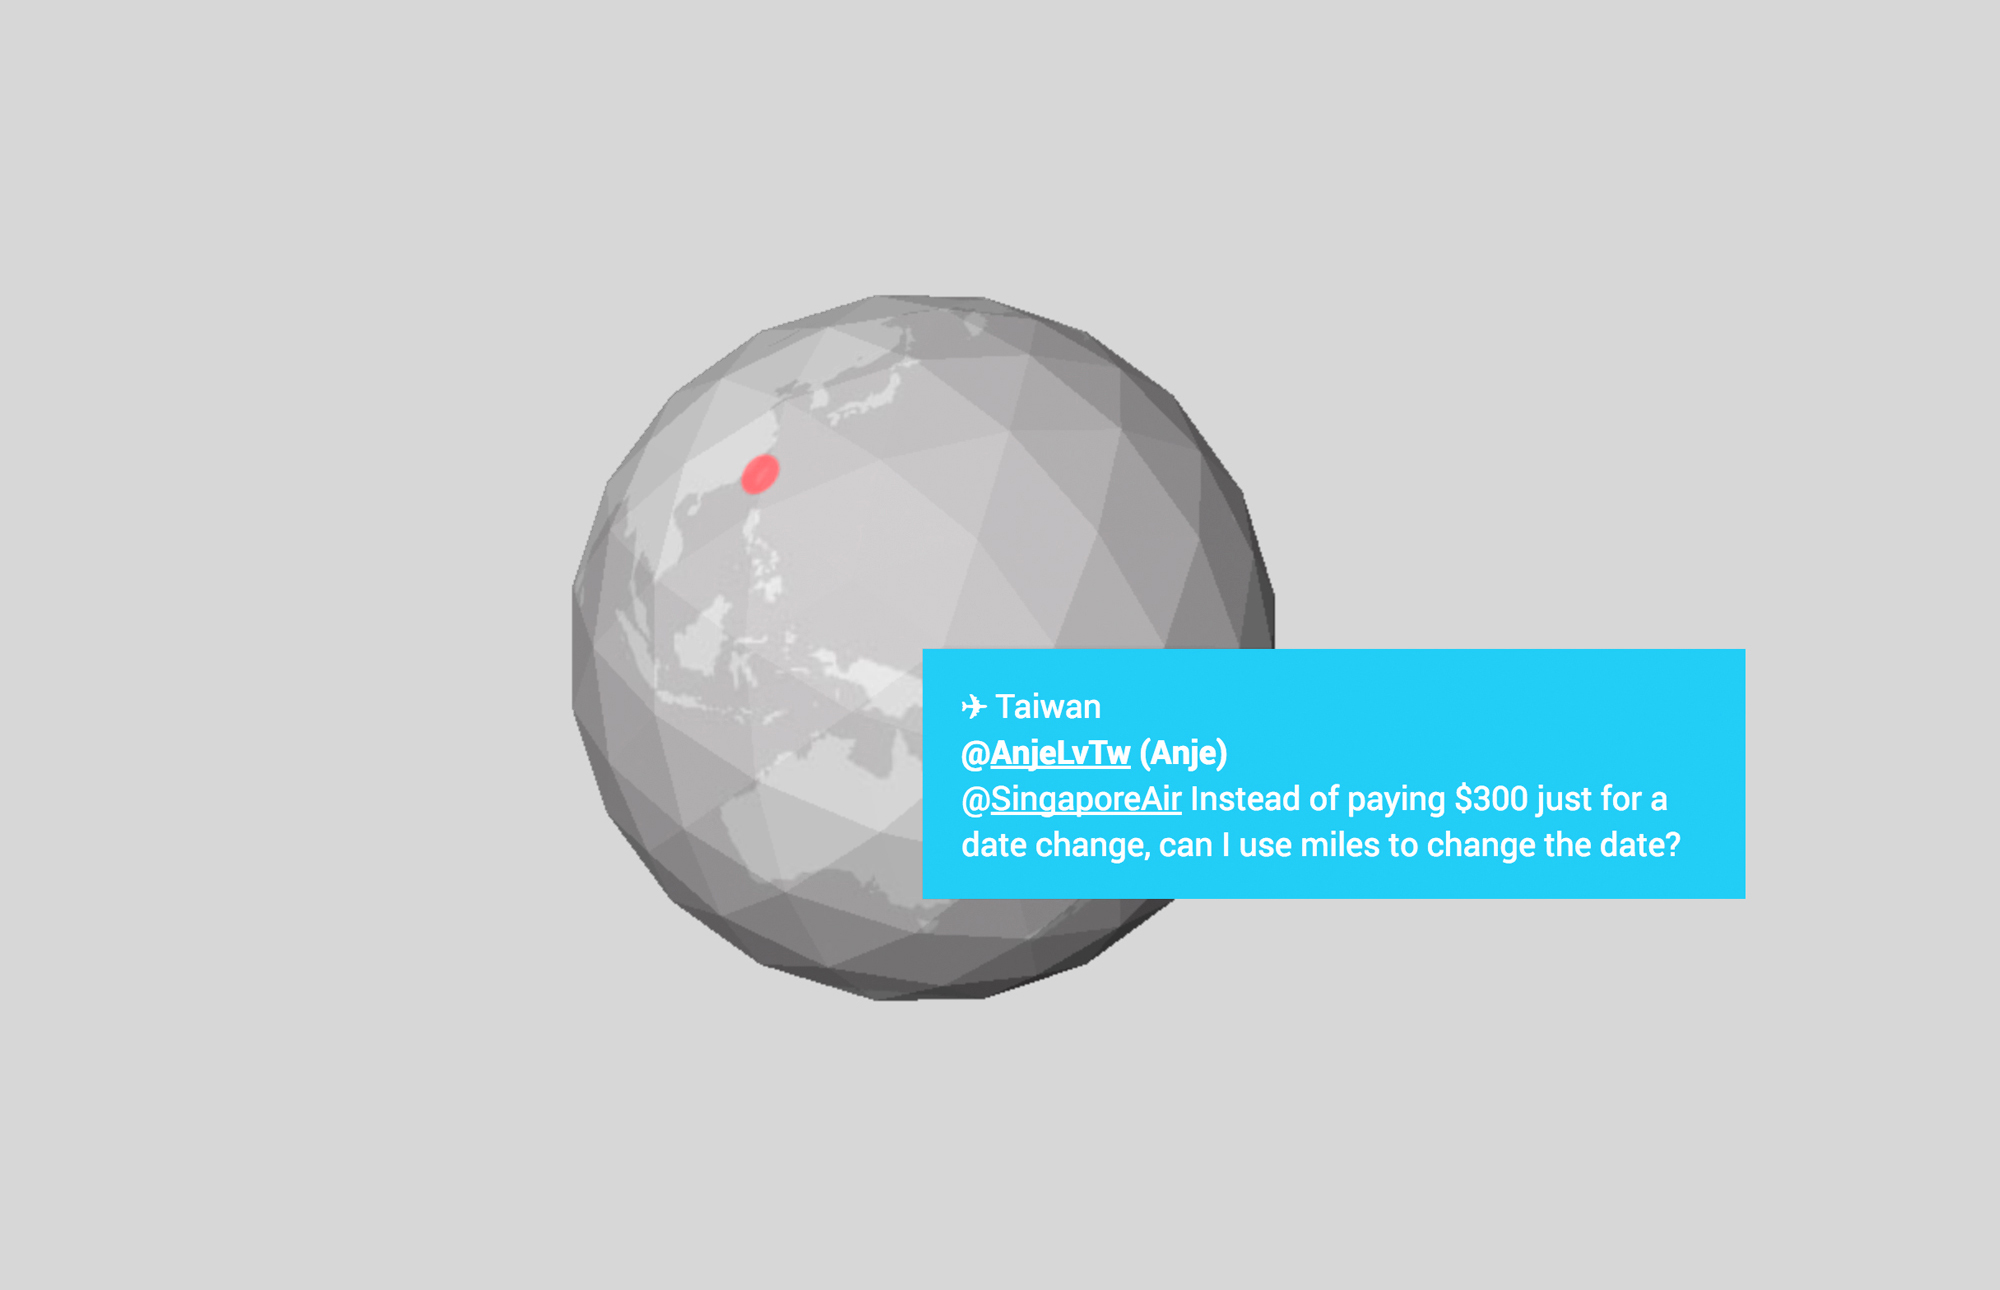
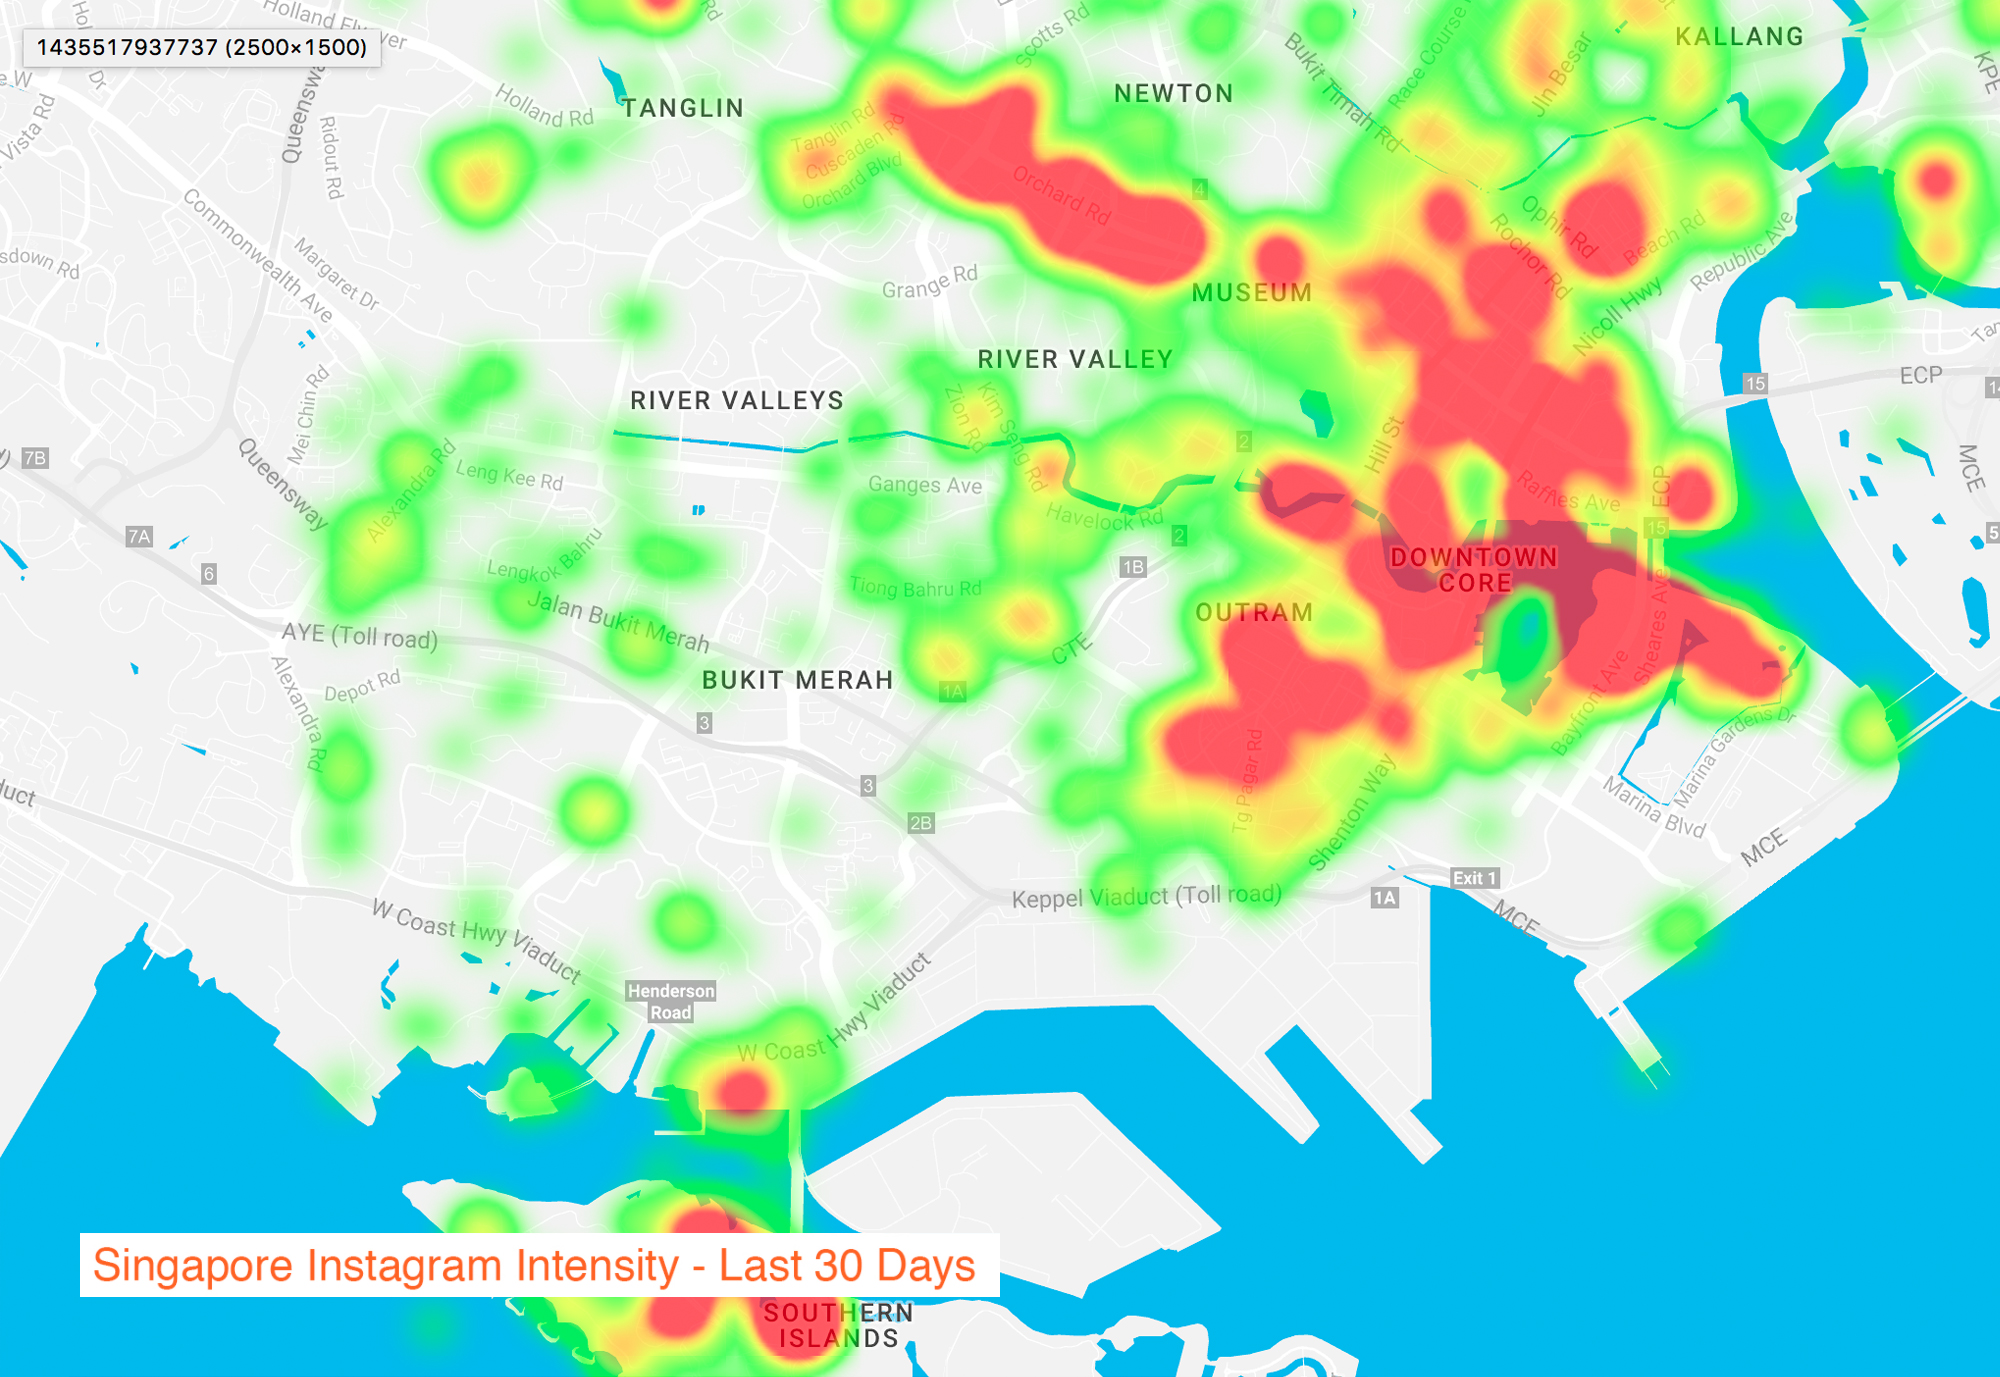

Working with the Strat team, I also built a social media wall, giving live metrics of our key clients and their competitors, news, trends and horoscopes. The wall to tonnes of insights we would have missed, and to opportunities to turn tweets into better and more responsive social interaction of behalf of our clients.
Concept, design, coding.
Javascript, ThreeJS, D3.js
Javascript, ThreeJS, D3.js